
Brian Sheng is the Co-Founder and CEO of Aquaria. Trained as an engineer at Princeton, where he studied water technology; co-inventor on Aquaria’s atmospheric water generation patent application.
Last updated: 2026-07-13
TL;DR: An atmospheric water generator (AWG) has predictable output, and it is set by two things you can look up for any city: air temperature and relative humidity. The Aquaria Hydropack X module is rated at 1,000 liters per day at 30°C and 80% relative humidity, and real output tracks how far local conditions sit from that point across the day. Because a machine runs around the clock, the honest figure is the average daily output across each month’s warm afternoons and cool nights, not a single midday snapshot. Warm, humid markets in Florida, on the Gulf, and in the tropics run near rating through the warm season and stay productive year-round (Miami averages about 849 liters per day). Cooler markets produce during the warm part of the day and idle overnight, so their daily average is lower. Hot arid markets such as Phoenix and Las Vegas are the genuine low end, because very dry air holds little water to condense no matter how hot it gets. The tables below give the annual ranking for 20 U.S. markets, with month-by-month detail for four representative climates and the full dataset available as a download.
What actually determines output: temperature and relative humidity
Two intuitions cause most disappointment with atmospheric water generation. The first is that a hot day is a good day for making water. The second is that a day that feels humid is a good day. Each is only half right, and on its own each is misleading.
Output is set by temperature and relative humidity together. Relative humidity measures how close the air is to saturation, which governs how readily water condenses on a cold surface. Temperature sets how much water the air can hold in the first place. You need both: warm air that is also close to saturation. Warm dry air (Phoenix in June) gives up little water because it is far from saturation. Cool damp air (San Francisco most of the year) is limited the other way, because cool air holds little water even at high relative humidity.
Both numbers move over the course of a day, and that matters. A winter morning can sit below the point where the machine runs, while the same afternoon is warm enough to produce steadily. Reporting output at a single monthly-average temperature hides this and understates cooler months. Aquaria instead computes the average daily output across each month’s full temperature swing, from the mean daily low to the mean daily high, using the lab-measured map. Both temperature and humidity normals are published for every U.S. city, so the result is grounded in standard climate data.
How do you read the output rating?
Aquaria rates the Hydropack X module at 1,000 liters per day at 30°C and 80% relative humidity. That is the optimal operating point, and we treat it as the 100% reference. It is not the number to expect every day, and we do not present it as one. Real output is usually below 1,000 liters per day because real conditions are usually below that optimum. The figures below are 24-hour averages: they already account for the machine producing more in the warm, humid hours and idling when the air is too cold or too dry.
Conversion used throughout: output (L/day) = 1,000 × (percent of rated ÷ 100). Gallons = liters × 0.264. Example: a 60% day is 600 L/day (about 158 gal/day); a 96% day is 960 L/day (about 253 gal/day).
Output by market (annual summary, ranked by water produced)
This is the citable overview. Each figure is the average daily output across the whole year, blending productive warm-season days with quieter cool-season days.
Monthly detail: four representative markets
The four markets below are the archetypes the rest of the table sorts into: a warm humid market (Miami), a mild coastal market (San Diego), a seasonal cool-continental market (New York), and a hot arid market (Phoenix). Read together, they show the full range the seasonal swing can take. Highs and lows are NOAA 1991–2020 mean daily maximum and minimum in Celsius (the 30°C rating point is 86°F). Average daily output is computed across each month’s temperature swing at that month’s humidity, counting only the hours the machine is within its operating range.
Miami: warm humid (Florida)
San Diego: mild coastal
New York: cool continental
Phoenix: hot arid
The part that surprises people
The markets that top the table are warm and humid at the same time, and they stay warm around the clock. Honolulu ranks second not because its air is the wettest, but because it never cools off: its nights stay near its days, so the machine rarely idles.
Corpus Christi and the Gulf get hot summers but cool winter nights, so the machine pauses overnight in the cool season and their yearly average sits below the tropics. Phoenix and Las Vegas are hot, which fools people into expecting good output, but their air is very dry, so production stays low for most of the year. Cool coastal markets such as San Francisco and Seattle feel damp, yet their air is never warm enough for long stretches, so they produce only during the mildest hours. The lesson is that neither heat alone nor a humid feel tells you anything. What matters is warm air that is also close to saturation, sustained across enough of the day, and that is what the map and these daily averages capture.
Where does output drop off?
Atmospheric water generation has honest limits, and we state them plainly. These figures credit only the hours when conditions are at or above about 13°C and 25% relative humidity, the practical operating range for the Hydropack X module. On a cool night the machine idles, and it resumes as the day warms. In markets where the air rarely clears that range, in cold winters or in genuinely arid air, output is low or zero and an atmospheric water generator is not the right primary water source. This is why Phoenix and Las Vegas sit at the bottom, why San Francisco is modest despite feeling damp, and why the northern markets fall off sharply in winter. The cases where atmospheric water generation does not make sense are covered in our companion article on when it is the wrong choice.
How should you size your system?
Do not size a system off the number on the box. Size it off your location’s realistic daily output in the months you most need water.
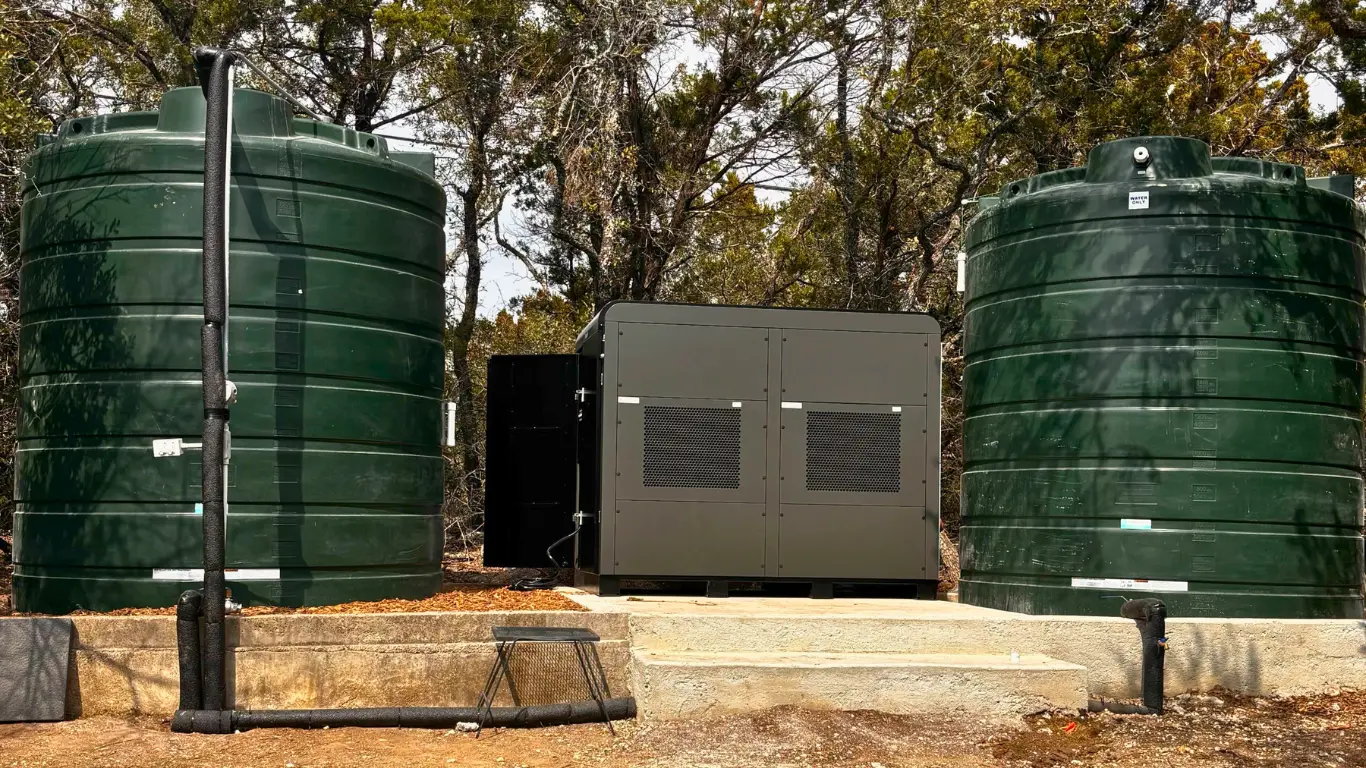
Find your market and month in the tables, read the average daily output, and match it to your household or site demand. In a warm, humid Florida, Gulf, or tropical market, a single Hydropack X module covers a large household for most of the year. In a mild coastal market, expect a steady but lower daily average. In a cooler or arid market, you accept seasonal variation, add modules, or pair the Hydropack with storage to bank water during the productive months.
The modular design of the Hydropack X exists for exactly this reason: match the number of modules to the water your location can actually produce. The tables give you the inputs to make that decision honestly rather than optimistically.
Methodology and sources
Temperatures are NOAA/NWS 1991–2020 U.S. Climate Normals: monthly mean daily maximum and mean daily minimum for each market’s primary weather station (for example Miami International Airport; New York uses Central Park; Austin uses Camp Mabry and Dallas uses Love Field, the long-running NWS climate sites for those cities). Relative humidity is the published monthly mean.
For each month we model the temperature moving from the mean daily low to the mean daily high and hold the day’s dew point constant, calibrated so the modeled 24-hour average relative humidity matches the published monthly mean. The output at each temperature and humidity is tested and modeled in Aquaria’s laboratory based on actual operating conditions, benchmarked against production at the 30°C, 80% relative humidity reference (defined as 100%) for the current-generation Hydropack X. We then average over the day, counting only the hours at or above 13°C and 25% relative humidity, the practical operating range. Daily output applies that average to the Hydropack X module rating of 1,000 liters per day.
We modeled the Hydropack X across every month and climate. You can view the complete dataset here — percent of rated output, liters per day, and a ranked summary, all in one sheet.
Three external references underpin the inputs:
- NOAA/NWS, U.S. Climate Normals (1991–2020), for temperature and humidity
- ASHRAE, Handbook of Fundamentals, for psychrometric relationships
- Arden L. Buck, “New Equations for Computing Vapor Pressure and Enhancement Factor,” Journal of Applied Meteorology, December 1981, for the saturation-vapor-pressure basis used in the dew-point calibration
Have questions about output in your area? Get in touch with our team and we'll help you figure out what's realistic for your home.
Frequently asked questions
Does an atmospheric water generator work in a dry climate?
Poorly. In hot arid markets such as Phoenix and Las Vegas the air is too dry for most of the year, so annual output is a small fraction of rating. An atmospheric water generator is not the right primary water source in genuinely arid climates.
How much water will I get in my city?
Find your city, or the closest climate match, in the monthly tables. A warm, humid market produces near the 1,000 L/day rating in the warm season and a large share of it year-round. A mild coastal market produces a lower steady daily average. A cold or arid market produces little in its off months.
Does it still work in winter?
In warm-winter markets, yes. In cooler markets the machine produces during the warm part of the day and idles overnight, so winter daily averages are lower, which the tables show month by month.
Why is output shown as a daily average instead of a fixed number?
Because conditions change through the day and the year, and the machine runs continuously. The daily average is the honest, location-specific figure. To convert percent of rated to liters per day for the Hydropack X, multiply the percent by 10: a 70% day is 700 L/day, a 96% day is 960 L/day.
Subscribe to our Newsletter
Get the latest updates, news and insights directly to your inbox
No payments for 6 months. Get your Hydropixel delivered free in the continental US.
Get Your Free Water Plan
Two quick steps. We'll send the right system size, expected output for your climate, and exact pricing — usually within one business day.